Project Overview
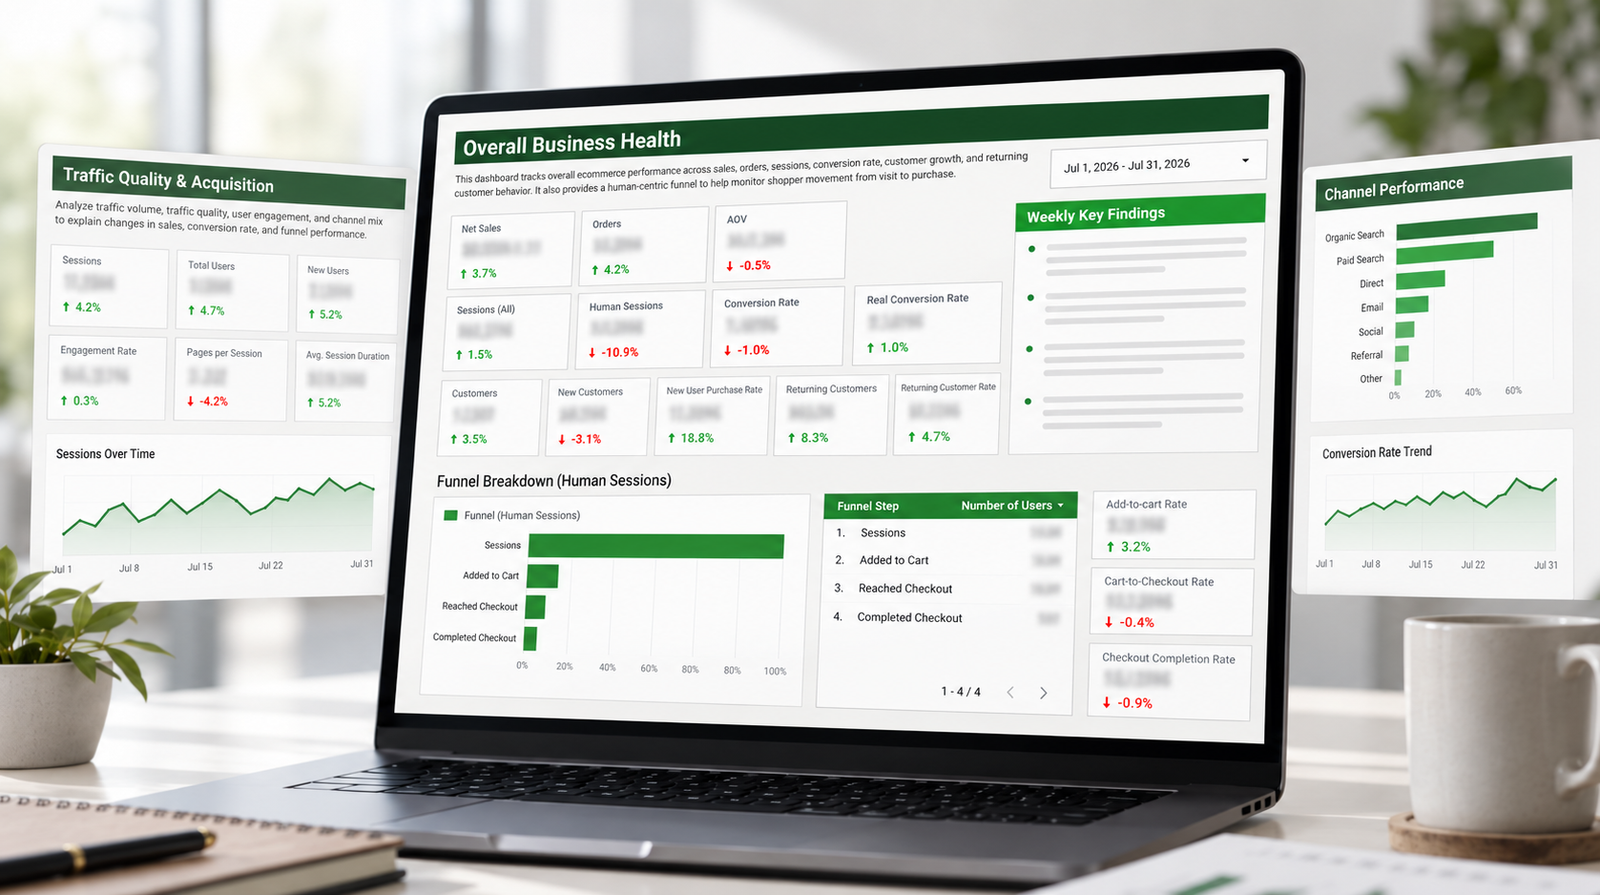
Performance data was available across Shopify, GA4 and other reporting sources, but reviewing topline KPIs alone made it difficult to understand what was actually driving a change in performance.
I built a reporting framework that connects business outcomes such as revenue, orders, AOV and conversion with traffic, funnel behavior and customer signals. The goal was to create a clearer path from what changed to why it changed, so weekly reporting could support more focused analysis and decisions.
The Challenge
The reporting process could show whether revenue, conversion or AOV had increased or declined, but the next question was harder to answer: what actually caused the change?
Performance signals were spread across different platforms and levels of the funnel. A change in revenue could be related to traffic volume, traffic quality, conversion behaviour, AOV, customer mix or a combination of several factors.
The challenge was therefore not simply to surface more metrics. It was to structure the data in a way that made the next area of investigation clearer.
The Approach
I structured the reporting around a simple diagnostic flow: establish reliable source metrics, compare performance consistently, then trace changes through the underlying drivers before turning them into clear priorities.
01
Establish the source of truth
Define which platform owns each KPI.
02
Structure the performance hierarchy
Organize reporting from business outcomes down through traffic, conversion behavior and supporting customer signals.
03
Compare performance consistently
Use current-versus-previous-period comparisons so changes can be evaluated against a relevant baseline.
04
Diagnose the drivers
Move beyond the topline result and investigate whether changes came from traffic, conversion, AOV, funnel performance or customer behaviour.
05
Translate findings into priorities
Surface the most meaningful changes and turn them into clear areas for further investigation or action.
What I Built
I built the reporting system to connect executive-level outcomes with the underlying performance drivers, making it easier to move from weekly results into focused diagnosis.
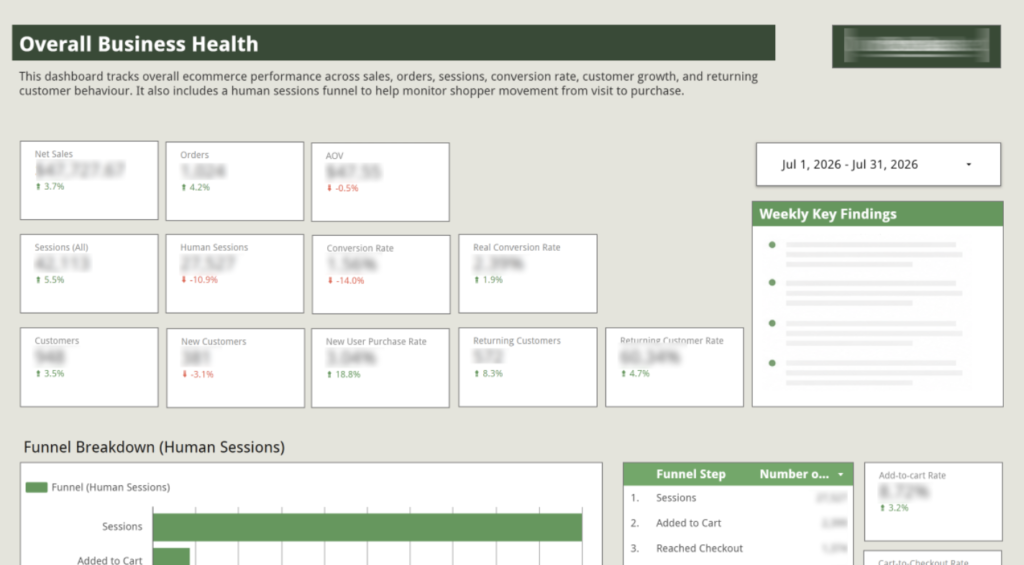
Executive Performance Overview
Brings together revenue, orders, AOV and conversion so overall business performance can be reviewed quickly before drilling into the metrics behind the change.
From Reporting to Diagnosis
A week-over-week increase in revenue can initially look like a traffic story. By reviewing AOV, conversion, orders and funnel behavior together, the reporting makes it possible to identify whether the improvement came from more visitors, stronger conversion, larger baskets, or a combination of factors.
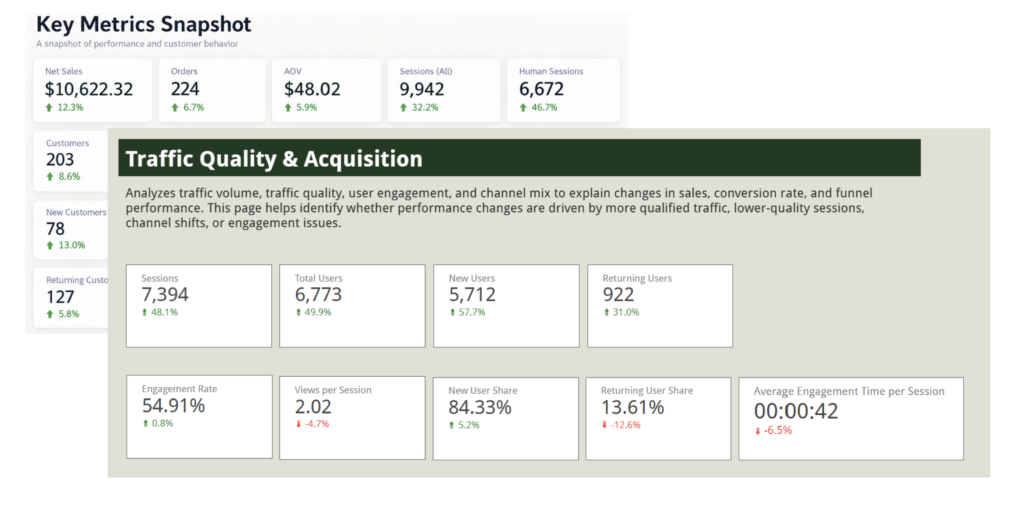
Example: Understanding a Revenue Increase
In this example, revenue, orders and AOV all increased, which could suggest stronger overall performance. However, conversion rate declined, so the next step was to investigate whether the uplift came from higher traffic volume, improved customer value, or a shift in traffic quality. A separate Traffic Quality & Acquisition view was then used to examine changes in user mix, engagement and traffic behavior. This helped connect the topline performance change with the traffic and engagement patterns behind it.
The Outcome
The result was more than a consolidated reporting dashboard. The system created a repeatable way to move from what changed to why it changed, connecting business outcomes with the traffic, conversion and customer signals needed for deeper investigation.
As the reporting process matured, I also introduced Weekly Key Findings—an AI-assisted analysis layer produced by an agent I designed and configured to review performance changes and surface the most relevant shifts for further investigation. This helped move the reporting from simply presenting metrics toward highlighting where attention was needed.
After being tested and refined in practice, the reporting system was integrated into weekly performance meetings, where it became part of the regular process for reviewing results, discussing drivers and deciding what required deeper analysis or action.
The system continues to evolve as new questions, data sources and business needs emerge. Rather than treating reporting as a finished deliverable, it operates as an ongoing feedback loop: review performance, diagnose the drivers, act on the findings, and refine the reporting based on what the team learns.
- Created a repeatable diagnostic process for separating traffic, conversion, AOV and customer-related performance drivers
- Added AI-assisted Weekly Key Findings to surface notable changes and guide deeper investigation
- Integrated reporting into weekly decision-making, giving stakeholders a shared view of performance and priorities
- Reduced the need to manually piece together metrics across multiple platforms
- Established an ongoing feedback loop, allowing the reporting system to evolve as new business questions emerge